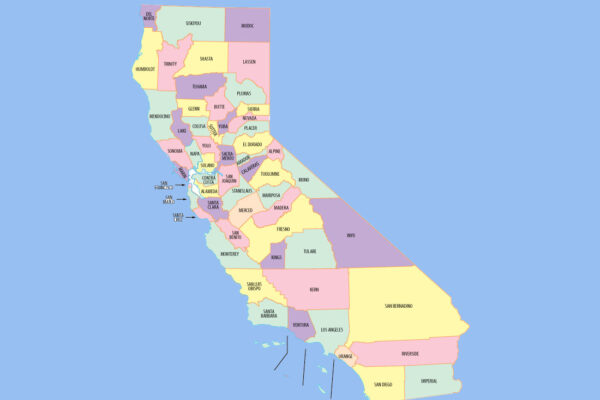
The following listings include racial demographics and statistics on minority faith congregations for California counties. To view the information, click on the county name.
Alameda County
Alameda County:
Population: 1,510,271 (2010)
| Race | Percent of Population |
|---|---|
| Caucasian | 33.9% |
| Hispanic/Latino | 22.8% |
| African American | 13.0% |
| Asian | 27.0% |
| Two or More Races Reported | 5.1% |
| American Indian/Native Alaskan | 1.2% |
| Native Hawaiian/Pacific Islander | 1.0% |
| Other | Percent of Population |
| Foreign Born | 30.7% |
| Language other than English in Home | 42.8% |
Congregations and Adherents as Percentage of Population (1980 and 2010)
| Year | Number of Congregations | Percent of Population |
|---|---|---|
| 1980 | 468 | 35.6% |
| 2010 | 1,091 | 33.7% |
Number of Minority Faith Congregations (2010)
| Baha’i | Buddhist | Hindu | Jewish | LDS | Muslim | Orthodox | Sikh |
|---|---|---|---|---|---|---|---|
| 12 | 49 | 27 | 15 | 46 | 27 | 6 | 4 |
Alpine County
Alpine County:
Population: 1,175 (2010)
| Race | Percent of Population |
|---|---|
| Caucasian | 70.5% |
| Hispanic/Latino | 7.7% |
| African American | 1.0% |
| Asian | 7.0% |
| Two or More Races Reported | 2.9% |
| American Indian/Native Alaskan | 21.8% |
| Native Hawaiian/Pacific Islander | 0.0% |
| Other | Percent of Population |
| Foreign Born | 4.6% |
| Language other than English in Home | 12.1% |
Congregations and Adherents as Percentage of Population (1980 and 2010)
| Year | Number of Congregations | Percent of Population |
|---|---|---|
| 1980 | 2 | 6.4% |
| 2010 | 1 | 4.3% |
Number of Minority Faith Congregations (2010)
| Baha’i | Buddhist | Hindu | Jewish | LDS | Muslim | Orthodox | Sikh |
|---|---|---|---|---|---|---|---|
| 0 | 0 | 0 | 0 | 0 | 0 | 0 | 0 |
Amador County
Amador County:
Population: 38,091 (2010)
| Race | Percent of Population |
|---|---|
| Caucasian | 79.3% |
| Hispanic/Latino | 12.9% |
| African American | 2.8% |
| Asian | 1.3% |
| Two or More Races Reported | 3.2% |
| American Indian/Native Alaskan | 2.1% |
| Native Hawaiian/Pacific Islander | 0.2% |
| Other | Percent of Population |
| Foreign Born | 5.8% |
| Language other than English in Home | 8.1% |
Congregations and Adherents as Percentage of Population (1980 and 2010)
| Year | Number of Congregations | Percent of Population |
|---|---|---|
| 1980 | 23 | 28.6% |
| 2010 | 47 | 24.4% |
Number of Minority Faith Congregations (2010)
| Baha’i | Buddhist | Hindu | Jewish | LDS | Muslim | Orthodox | Sikh |
|---|---|---|---|---|---|---|---|
| 0 | 0 | 1 | 0 | 2 | 0 | 1 | 0 |
Butte County
Butte County:
Population: 220,000 (2010)
| Race | Percent of Population |
|---|---|
| Caucasian | 74.5% |
| Hispanic/Latino | 14.7% |
| African American | 1.8% |
| Asian | 4.4% |
| Two or More Races Reported | 4.2% |
| American Indian/Native Alaskan | 2.3% |
| Native Hawaiian/Pacific Islander | 0.3% |
| Other | Percent of Population |
| Foreign Born | 7.9% |
| Language other than English in Home | 14.3% |
Congregations and Adherents as Percentage of Population (1980 and 2010)
| Year | Number of Congregations | Percent of Population |
|---|---|---|
| 1980 | 110 | 25.5% |
| 2010 | 202 | 34.1% |
Number of Minority Faith Congregations (2010)
| Baha’i | Buddhist | Hindu | Jewish | LDS | Muslim | Orthodox | Sikh |
|---|---|---|---|---|---|---|---|
| 2 | 4 | 0 | 1 | 16 | 1 | 2 | 0 |
Calaveras County
Calaveras County:
Population: 45,578 (2010)
| Race | Percent of Population |
|---|---|
| Caucasian | 82.9% |
| Hispanic/Latino | 10.8% |
| African American | 1.0% |
| Asian | 1.4% |
| Two or More Races Reported | 3.4% |
| American Indian/Native Alaskan | 1.8% |
| Native Hawaiian/Pacific Islander | 0.2% |
| Other | Percent of Population |
| Foreign Born | 4.3% |
| Language other than English in Home | 7.1% |
Congregations and Adherents as Percentage of Population (1980 and 2010)
| Year | Number of Congregations | Percent of Population |
|---|---|---|
| 1980 | 30 | 28.7% |
| 2010 | 61 | 69.0% |
Number of Minority Faith Congregations (2010)
| Baha’i | Buddhist | Hindu | Jewish | LDS | Muslim | Orthodox | Sikh |
|---|---|---|---|---|---|---|---|
| 0 | 1 | 0 | 0 | 3 | 0 | 2 | 0 |
Colusa County
Colusa County:
Population: 21,419 (2010)
| Race | Percent of Population |
|---|---|
| Caucasian | 39.0% |
| Hispanic/Latino | 56.1% |
| African American | 1.1% |
| Asian | 1.6% |
| Two or More Races Reported | 2.0% |
| American Indian/Native Alaskan | 2.7% |
| Native Hawaiian/Pacific Islander | 5.0% |
| Other | Percent of Population |
| Foreign Born | 24.2% |
| Language other than English in Home | 45.7% |
Congregations and Adherents as Percentage of Population (1980 and 2010)
| Year | Number of Congregations | Percent of Population |
|---|---|---|
| 1980 | 25 | 32.5% |
| 2010 | 29 | 53.2% |
Number of Minority Faith Congregations (2010)
| Baha’i | Buddhist | Hindu | Jewish | LDS | Muslim | Orthodox | Sikh |
|---|---|---|---|---|---|---|---|
| 0 | 0 | 0 | 0 | 1 | 0 | 0 | 0 |
Contra Costa County
Contra Costa County:
Population: 1,049,025 (2010)
| Race | Percent of Population |
|---|---|
| Caucasian | 47.3% |
| Hispanic/Latino | 24.8% |
| African American | 9.7% |
| Asian | 15.2% |
| Two or More Races Reported | 4.8% |
| American Indian/Native Alaskan | 1.0% |
| Native Hawaiian/Pacific Islander | 0.6% |
| Other | Percent of Population |
| Foreign Born | 23.6% |
| Language other than English in Home | 32.8% |
Congregations and Adherents as Percentage of Population (1980 and 2010)
| Year | Number of Congregations | Percent of Population |
|---|---|---|
| 1980 | 321 | 37.1% |
| 2010 | 652 | 38.5% |
Number of Minority Faith Congregations (2010)
| Baha’i | Buddhist | Hindu | Jewish | LDS | Muslim | Orthodox | Sikh |
|---|---|---|---|---|---|---|---|
| 16 | 13 | 6 | 7 | 42 | 9 | 5 | 3 |
Del Norte County
Del Norte County:
Population: 28,610 (2010)
| Race | Percent of Population |
|---|---|
| Caucasian | 64.2% |
| Hispanic/Latino | 18.4% |
| African American | 4.0% |
| Asian | 3.5% |
| Two or More Races Reported | 4.3% |
| American Indian/Native Alaskan | 8.6% |
| Native Hawaiian/Pacific Islander | 0.2% |
| Other | Percent of Population |
| Foreign Born | 6.7% |
| Language other than English in Home | 17.2% |
Congregations and Adherents as Percentage of Population (1980 and 2010)
| Year | Number of Congregations | Percent of Population |
|---|---|---|
| 1980 | 19 | 36.0% |
| 2010 | 32 | 20.8% |
Number of Minority Faith Congregations (2010)
| Baha’i | Buddhist | Hindu | Jewish | LDS | Muslim | Orthodox | Sikh |
|---|---|---|---|---|---|---|---|
| 1 | 1 | 0 | 0 | 2 | 0 | 0 | 0 |
El Dorado County
El Dorado County:
Population: 181,058 (2010)
| Race | Percent of Population |
|---|---|
| Caucasian | 79.6% |
| Hispanic/Latino | 12.3% |
| African American | 0.9% |
| Asian | 3.7% |
| Two or More Races Reported | 3.3% |
| American Indian/Native Alaskan | 1.4% |
| Native Hawaiian/Pacific Islander | 0.2% |
| Other | Percent of Population |
| Foreign Born | 8.4% |
| Language other than English in Home | 12.2% |
Congregations and Adherents as Percentage of Population (1980 and 2010)
| Year | Number of Congregations | Percent of Population |
|---|---|---|
| 1980 | 49 | 19.5% |
| 2010 | 118 | 28.7% |
Number of Minority Faith Congregations (2010)
| Baha’i | Buddhist | Hindu | Jewish | LDS | Muslim | Orthodox | Sikh |
|---|---|---|---|---|---|---|---|
| 2 | 0 | 2 | 1 | 15 | 1 | 2 | 0 |
Fresno County
Fresno County:
Population: 930,450 (2010)
| Race | Percent of Population |
|---|---|
| Caucasian | 32.4% |
| Hispanic/Latino | 50.9% |
| African American | 5.9% |
| Asian | 10.3% |
| Two or More Races Reported | 2.9% |
| American Indian/Native Alaskan | 3.0% |
| Native Hawaiian/Pacific Islander | 0.3% |
| Other | Percent of Population |
| Foreign Born | 22.1% |
| Language other than English in Home | 42.9% |
Congregations and Adherents as Percentage of Population (1980 and 2010)
| Year | Number of Congregations | Percent of Population |
|---|---|---|
| 1980 | 392 | 39.4% |
| 2010 | 701 | 51.7% |
Number of Minority Faith Congregations (2010)
| Baha’i | Buddhist | Hindu | Jewish | LDS | Muslim | Orthodox | Sikh |
|---|---|---|---|---|---|---|---|
| 2 | 16 | 5 | 3 | 36 | 4 | 4 | 6 |
Glenn County
Glenn County:
Population: 28,122 (2010)
| Race | Percent of Population |
|---|---|
| Caucasian | 55.0% |
| Hispanic/Latino | 38.4% |
| African American | 1.2% |
| Asian | 2.9% |
| Two or More Races Reported | 2.8% |
| American Indian/Native Alaskan | 3.1% |
| Native Hawaiian/Pacific Islander | 0.2% |
| Other | Percent of Population |
| Foreign Born | 15.6% |
| Language other than English in Home | 34.0% |
Congregations and Adherents as Percentage of Population (1980 and 2010)
| Year | Number of Congregations | Percent of Population |
|---|---|---|
| 1980 | 33 | 43.4% |
| 2010 | 49 | 39.6% |
Number of Minority Faith Congregations (2010)
| Baha’i | Buddhist | Hindu | Jewish | LDS | Muslim | Orthodox | Sikh |
|---|---|---|---|---|---|---|---|
| 0 | 0 | 0 | 0 | 3 | 0 | 0 | 0 |
Humboldt County
Humboldt County:
Population: 134,623 (2010)
| Race | Percent of Population |
|---|---|
| Caucasian | 76.8% |
| Hispanic/Latino | 10.2% |
| African American | 1.3% |
| Asian | 2.5% |
| Two or More Races Reported | 5.1% |
| American Indian/Native Alaskan | 6.0% |
| Native Hawaiian/Pacific Islander | 0.3% |
| Other | Percent of Population |
| Foreign Born | 5.6% |
| Language other than English in Home | 9.4% |
Congregations and Adherents as Percentage of Population (1980 and 2010)
| Year | Number of Congregations | Percent of Population |
|---|---|---|
| 1980 | 130 | 30.7% |
| 2010 | 177 | 21.5% |
Number of Minority Faith Congregations (2010)
| Baha’i | Buddhist | Hindu | Jewish | LDS | Muslim | Orthodox | Sikh |
|---|---|---|---|---|---|---|---|
| 1 | 10 | 3 | 1 | 7 | 0 | 1 | 0 |
Imperial County
Imperial County:
Population: 174,528 (2010)
| Race | Percent of Population |
|---|---|
| Caucasian | 13.5% |
| Hispanic/Latino | 80.6% |
| African American | 3.8% |
| Asian | 2.4% |
| Two or More Races Reported | 1.8% |
| American Indian/Native Alaskan | 2.6% |
| Native Hawaiian/Pacific Islander | 0.2% |
| Other | Percent of Population |
| Foreign Born | 32.0% |
| Language other than English in Home | 73.8% |
Congregations and Adherents as Percentage of Population (1980 and 2010)
| Year | Number of Congregations | Percent of Population |
|---|---|---|
| 1980 | 86 | 55.0% |
| 2010 | 123 | 38.6% |
Number of Minority Faith Congregations (2010)
| Baha’i | Buddhist | Hindu | Jewish | LDS | Muslim | Orthodox | Sikh |
|---|---|---|---|---|---|---|---|
| 0 | 1 | 0 | 1 | 5 | 1 | 0 | 0 |
Inyo County
Inyo County:
Population: 18,546 (2010)
| Race | Percent of Population |
|---|---|
| Caucasian | 65.7% |
| Hispanic/Latino | 20.1% |
| African American | 0.9% |
| Asian | 1.3% |
| Two or More Races Reported | 3.0% |
| American Indian/Native Alaskan | 12.4% |
| Native Hawaiian/Pacific Islander | 0.1% |
| Other | Percent of Population |
| Foreign Born | 9.8% |
| Language other than English in Home | 15.1% |
Congregations and Adherents as Percentage of Population (1980 and 2010)
| Year | Number of Congregations | Percent of Population |
|---|---|---|
| 1980 | 34 | 46.0% |
| 2010 | 38 | 43.0% |
Number of Minority Faith Congregations (2010)
| Baha’i | Buddhist | Hindu | Jewish | LDS | Muslim | Orthodox | Sikh |
|---|---|---|---|---|---|---|---|
| 0 | 0 | 0 | 0 | 2 | 0 | 0 | 0 |
Kern County
Kern County:
Population: 839,631 (2010)
| Race | Percent of Population |
|---|---|
| Caucasian | 37.9% |
| Hispanic/Latino | 50.0% |
| African American | 6.3% |
| Asian | 4.7% |
| Two or More Races Reported | 3.0% |
| American Indian/Native Alaskan | 2.7% |
| Native Hawaiian/Pacific Islander | 0.3% |
| Other | Percent of Population |
| Foreign Born | 20.5% |
| Language other than English in Home | 41.3% |
Congregations and Adherents as Percentage of Population (1980 and 2010)
| Year | Number of Congregations | Percent of Population |
|---|---|---|
| 1980 | 354 | 40.3% |
| 2010 | 615 | 48.0% |
Number of Minority Faith Congregations (2010)
| Baha’i | Buddhist | Hindu | Jewish | LDS | Muslim | Orthodox | Sikh |
|---|---|---|---|---|---|---|---|
| 1 | 4 | 4 | 3 | 39 | 4 | 3 | 2 |
Kings County
Kings County:
Population: 152,982 (2010)
| Race | Percent of Population |
|---|---|
| Caucasian | 35.0% |
| Hispanic/Latino | 51.4% |
| African American | 7.9% |
| Asian | 4.2% |
| Two or More Races Reported | 3.5% |
| American Indian/Native Alaskan | 2.9% |
| Native Hawaiian/Pacific Islander | 0.3% |
| Other | Percent of Population |
| Foreign Born | 21.1% |
| Language other than English in Home | 42.4% |
Congregations and Adherents as Percentage of Population (1980 and 2010)
| Year | Number of Congregations | Percent of Population |
|---|---|---|
| 1980 | 90 | 41.0% |
| 2010 | 112 | 55.4% |
Number of Minority Faith Congregations (2010)
| Baha’i | Buddhist | Hindu | Jewish | LDS | Muslim | Orthodox | Sikh |
|---|---|---|---|---|---|---|---|
| 0 | 1 | 0 | 0 | 5 | 1 | 0 | 0 |
Lake County
Lake County:
Population: 64,665 (2010)
| Race | Percent of Population |
|---|---|
| Caucasian | 73.7% |
| Hispanic/Latino | 17.7% |
| African American | 2.0% |
| Asian | 1.3% |
| Two or More Races Reported | 4.1% |
| American Indian/Native Alaskan | 4.0% |
| Native Hawaiian/Pacific Islander | 0.2% |
| Other | Percent of Population |
| Foreign Born | 8.5% |
| Language other than English in Home | 13.6% |
Congregations and Adherents as Percentage of Population (1980 and 2010)
| Year | Number of Congregations | Percent of Population |
|---|---|---|
| 1980 | 50 | 25.7% |
| 2010 | 81 | 25.5% |
Number of Minority Faith Congregations (2010)
| Baha’i | Buddhist | Hindu | Jewish | LDS | Muslim | Orthodox | Sikh |
|---|---|---|---|---|---|---|---|
| 0 | 2 | 2 | 0 | 6 | 0 | 1 | 0 |
Lassen County
Lassen County:
Population: 34,895 (2010)
| Race | Percent of Population |
|---|---|
| Caucasian | 66.2% |
| Hispanic/Latino | 18.0% |
| African American | 9.1% |
| Asian | 1.3% |
| Two or More Races Reported | 3.3% |
| American Indian/Native Alaskan | 4.2% |
| Native Hawaiian/Pacific Islander | 0.5% |
| Other | Percent of Population |
| Foreign Born | 7.0% |
| Language other than English in Home | 18.2% |
Congregations and Adherents as Percentage of Population (1980 and 2010)
| Year | Number of Congregations | Percent of Population |
|---|---|---|
| 1980 | 28 | 21.7% |
| 2010 | 41 | 23.4% |
Number of Minority Faith Congregations (2010)
| Baha’i | Buddhist | Hindu | Jewish | LDS | Muslim | Orthodox | Sikh |
|---|---|---|---|---|---|---|---|
| 0 | 0 | 0 | 0 | 3 | 0 | 0 | 0 |
Los Angeles County
Los Angeles County:
Population: 9,818,605 (2010)
| Race | Percent of Population |
|---|---|
| Caucasian | 27.6% |
| Hispanic/Latino | 48.1% |
| African American | 9.3% |
| Asian | 14.2% |
| Two or More Races Reported | 2.8% |
| American Indian/Native Alaskan | 1.5% |
| Native Hawaiian/Pacific Islander | 0.4% |
| Other | Percent of Population |
| Foreign Born | 35.6% |
| Language other than English in Home | 56.6% |
Congregations and Adherents as Percentage of Population (1980 and 2010)
| Year | Number of Congregations | Percent of Population |
|---|---|---|
| 1980 | 2,837 | 39.2% |
| 2010 | 5,773 | 53.1% |
Number of Minority Faith Congregations (2010)
| Baha’i | Buddhist | Hindu | Jewish | LDS | Muslim | Orthodox | Sikh |
|---|---|---|---|---|---|---|---|
| 39 | 182 | 78 | 202 | 231 | 59 | 76 | 14 |
Madera County
Madera County:
Population: 150,865 (2010)
| Race | Percent of Population |
|---|---|
| Caucasian | 37.5% |
| Hispanic/Latino | 54.5% |
| African American | 4.4% |
| Asian | 2.2% |
| Two or More Races Reported | 2.4% |
| American Indian/Native Alaskan | 4.5% |
| Native Hawaiian/Pacific Islander | 0.2% |
| Other | Percent of Population |
| Foreign Born | 21.3% |
| Language other than English in Home | 43.3% |
Congregations and Adherents as Percentage of Population (1980 and 2010)
| Year | Number of Congregations | Percent of Population |
|---|---|---|
| 1980 | 59 | 35.7% |
| 2010 | 126 | 53.0% |
Number of Minority Faith Congregations (2010)
| Baha’i | Buddhist | Hindu | Jewish | LDS | Muslim | Orthodox | Sikh |
|---|---|---|---|---|---|---|---|
| 1 | 2 | 0 | 0 | 5 | 1 | 0 | 0 |
Marin County
Marin County:
Population: 252,409 (2010)
| Race | Percent of Population |
|---|---|
| Caucasian | 72.7% |
| Hispanic/Latino | 15.7% |
| African American | 3.0% |
| Asian | 5.8% |
| Two or More Races Reported | 3.5% |
| American Indian/Native Alaskan | 1.2% |
| Native Hawaiian/Pacific Islander | 0.3% |
| Other | Percent of Population |
| Foreign Born | 18.5% |
| Language other than English in Home | 22.8% |
Congregations and Adherents as Percentage of Population (1980 and 2010)
| Year | Number of Congregations | Percent of Population |
|---|---|---|
| 1980 | 106 | 27.1% |
| 2010 | 204 | 43.5% |
Number of Minority Faith Congregations (2010)
| Baha’i | Buddhist | Hindu | Jewish | LDS | Muslim | Orthodox | Sikh |
|---|---|---|---|---|---|---|---|
| 4 | 19 | 7 | 4 | 5 | 1 | 3 | 0 |
Mariposa County
Mariposa County:
Population: 18,251 (2010)
| Race | Percent of Population |
|---|---|
| Caucasian | 82.4% |
| Hispanic/Latino | 9.9% |
| African American | 0.9% |
| Asian | 1.3% |
| Two or More Races Reported | 3.6% |
| American Indian/Native Alaskan | 3.2% |
| Native Hawaiian/Pacific Islander | 0.2% |
| Other | Percent of Population |
| Foreign Born | 4.8% |
| Language other than English in Home | 9.2% |
Congregations and Adherents as Percentage of Population (1980 and 2010)
| Year | Number of Congregations | Percent of Population |
|---|---|---|
| 1980 | 17 | 16.1% |
| 2010 | 31 | 42.3% |
Number of Minority Faith Congregations (2010)
| Baha’i | Buddhist | Hindu | Jewish | LDS | Muslim | Orthodox | Sikh |
|---|---|---|---|---|---|---|---|
| 1 | 0 | 0 | 0 | 1 | 0 | 0 | 0 |
Mendocino County
Mendocino County:
Population: 87,841 (2010)
| Race | Percent of Population |
|---|---|
| Caucasian | 68.0% |
| Hispanic/Latino | 22.9% |
| African American | 1.0% |
| Asian | 1.9% |
| Two or More Races Reported | 3.7% |
| American Indian/Native Alaskan | 6.1% |
| Native Hawaiian/Pacific Islander | 0.2% |
| Other | Percent of Population |
| Foreign Born | 11.8% |
| Language other than English in Home | 20.6% |
Congregations and Adherents as Percentage of Population (1980 and 2010)
| Year | Number of Congregations | Percent of Population |
|---|---|---|
| 1980 | 72 | 25.3% |
| 2010 | 119 | 32.7% |
Number of Minority Faith Congregations (2010)
| Baha’i | Buddhist | Hindu | Jewish | LDS | Muslim | Orthodox | Sikh |
|---|---|---|---|---|---|---|---|
| 0 | 12 | 2 | 0 | 4 | 0 | 0 | 0 |
Merced County
Merced County:
Population: 255,793 (2010)
| Race | Percent of Population |
|---|---|
| Caucasian | 31.3% |
| Hispanic/Latino | 55.7% |
| African American | 4.3% |
| Asian | 7.9% |
| Two or More Races Reported | 2.9% |
| American Indian/Native Alaskan | 2.4% |
| Native Hawaiian/Pacific Islander | 0.4% |
| Other | Percent of Population |
| Foreign Born | 25.0% |
| Language other than English in Home | 51.8% |
Congregations and Adherents as Percentage of Population (1980 and 2010)
| Year | Number of Congregations | Percent of Population |
|---|---|---|
| 1980 | 103 | 44.5% |
| 2010 | 192 | 54.5% |
Number of Minority Faith Congregations (2010)
| Baha’i | Buddhist | Hindu | Jewish | LDS | Muslim | Orthodox | Sikh |
|---|---|---|---|---|---|---|---|
| 1 | 1 | 0 | 1 | 10 | 1 | 1 | 2 |
Modoc County
Modoc County:
Population: 9,686 (2010)
| Race | Percent of Population |
|---|---|
| Caucasian | 78.1% |
| Hispanic/Latino | 14.3% |
| African American | 1.2% |
| Asian | 1.1% |
| Two or More Races Reported | 3.4% |
| American Indian/Native Alaskan | 5.2% |
| Native Hawaiian/Pacific Islander | 0.2% |
| Other | Percent of Population |
| Foreign Born | 6.7% |
| Language other than English in Home | 14.8% |
Congregations and Adherents as Percentage of Population (1980 and 2010)
| Year | Number of Congregations | Percent of Population |
|---|---|---|
| 1980 | 16 | 21.8% |
| 2010 | 16 | 15.1% |
Number of Minority Faith Congregations (2010)
| Baha’i | Buddhist | Hindu | Jewish | LDS | Muslim | Orthodox | Sikh |
|---|---|---|---|---|---|---|---|
| 0 | 0 | 0 | 0 | 2 | 0 | 0 | 0 |
Mono County
Mono County:
Population: 14,202 (2010)
| Race | Percent of Population |
|---|---|
| Caucasian | 67.2% |
| Hispanic/Latino | 27.0% |
| African American | 0.6% |
| Asian | 1.7% |
| Two or More Races Reported | 2.5% |
| American Indian/Native Alaskan | 2.6% |
| Native Hawaiian/Pacific Islander | 0.1% |
| Other | Percent of Population |
| Foreign Born | 18.0% |
| Language other than English in Home | 23.1% |
Congregations and Adherents as Percentage of Population (1980 and 2010)
| Year | Number of Congregations | Percent of Population |
|---|---|---|
| 1980 | 11 | 7.4% |
| 2010 | 16 | 96.1% |
Number of Minority Faith Congregations (2010)
| Baha’i | Buddhist | Hindu | Jewish | LDS | Muslim | Orthodox | Sikh |
|---|---|---|---|---|---|---|---|
| 0 | 0 | 0 | 0 | 2 | 0 | 0 | 0 |
Monterey County
Monterey County:
Population: 415,057 (2010)
| Race | Percent of Population |
|---|---|
| Caucasian | 32.4% |
| Hispanic/Latino | 56.1% |
| African American | 3.7% |
| Asian | 6.9% |
| Two or More Races Reported | 3.7% |
| American Indian/Native Alaskan | 2.7% |
| Native Hawaiian/Pacific Islander | 0.6% |
| Other | Percent of Population |
| Foreign Born | 30.3% |
| Language other than English in Home | 52.1% |
Congregations and Adherents as Percentage of Population (1980 and 2010)
| Year | Number of Congregations | Percent of Population |
|---|---|---|
| 1980 | 142 | 28.4% |
| 2010 | 287 | 49.4% |
Number of Minority Faith Congregations (2010)
| Baha’i | Buddhist | Hindu | Jewish | LDS | Muslim | Orthodox | Sikh |
|---|---|---|---|---|---|---|---|
| 1 | 14 | 2 | 4 | 11 | 3 | 3 | 1 |
Napa County
Napa County:
Population: 136,484 (2010)
| Race | Percent of Population |
|---|---|
| Caucasian | 55.6% |
| Hispanic/Latino | 32.9% |
| African American | 2.3% |
| Asian | 0.4% |
| Two or More Races Reported | 3.0% |
| American Indian/Native Alaskan | 1.3% |
| Native Hawaiian/Pacific Islander | 0.4% |
| Other | Percent of Population |
| Foreign Born | 22.1% |
| Language other than English in Home | 34.1% |
Congregations and Adherents as Percentage of Population (1980 and 2010)
| Year | Number of Congregations | Percent of Population |
|---|---|---|
| 1980 | 58 | 35.3% |
| 2010 | 101 | 52.3% |
Number of Minority Faith Congregations (2010)
| Baha’i | Buddhist | Hindu | Jewish | LDS | Muslim | Orthodox | Sikh |
|---|---|---|---|---|---|---|---|
| 1 | 3 | 1 | 1 | 6 | 3 | 2 | 0 |
Nevada County
Nevada County:
Population: 98,764 (2010)
| Race | Percent of Population |
|---|---|
| Caucasian | 86.2% |
| Hispanic/Latino | 8.9% |
| African American | 0.5% |
| Asian | 1.3% |
| Two or More Races Reported | 2.9% |
| American Indian/Native Alaskan | 1.2% |
| Native Hawaiian/Pacific Islander | 0.1% |
| Other | Percent of Population |
| Foreign Born | 5.4% |
| Language other than English in Home | 7.0% |
Congregations and Adherents as Percentage of Population (1980 and 2010)
| Year | Number of Congregations | Percent of Population |
|---|---|---|
| 1980 | 37 | 20.0% |
| 2010 | 87 | 31.4% |
Number of Minority Faith Congregations (2010)
| Baha’i | Buddhist | Hindu | Jewish | LDS | Muslim | Orthodox | Sikh |
|---|---|---|---|---|---|---|---|
| 2 | 7 | 6 | 1 | 3 | 0 | 0 | 0 |
Orange County
Orange County:
Population: 3,010,232 (2010)
| Race | Percent of Population |
|---|---|
| Caucasian | 43.5% |
| Hispanic/Latino | 34.1% |
| African American | 2.1% |
| Asian | 18.4% |
| Two or More Races Reported | 3.1% |
| American Indian/Native Alaskan | 1.1% |
| Native Hawaiian/Pacific Islander | 0.4% |
| Other | Percent of Population |
| Foreign Born | 30.5% |
| Language other than English in Home | 44.7% |
Congregations and Adherents as Percentage of Population (1980 and 2010)
| Year | Number of Congregations | Percent of Population |
|---|---|---|
| 1980 | 617 | 32.1% |
| 2010 | 1,519 | 45.8% |
Number of Minority Faith Congregations (2010)
| Baha’i | Buddhist | Hindu | Jewish | LDS | Muslim | Orthodox | Sikh |
|---|---|---|---|---|---|---|---|
| 24 | 61 | 15 | 24 | 124 | 20 | 41 | 5 |
Placer County
Placer County:
Population: 348,432 (2010)
| Race | Percent of Population |
|---|---|
| Caucasian | 75.4% |
| Hispanic/Latino | 13.3% |
| African American | 1.6% |
| Asian | 6.3% |
| Two or More Races Reported | 3.8% |
| American Indian/Native Alaskan | 1.1% |
| Native Hawaiian/Pacific Islander | 0.3% |
| Other | Percent of Population |
| Foreign Born | 10.3% |
| Language other than English in Home | 14.2% |
Congregations and Adherents as Percentage of Population (1980 and 2010)
| Year | Number of Congregations | Percent of Population |
|---|---|---|
| 1980 | 88 | 27.4% |
| 2010 | 253 | 38.4% |
Number of Minority Faith Congregations (2010)
| Baha’i | Buddhist | Hindu | Jewish | LDS | Muslim | Orthodox | Sikh |
|---|---|---|---|---|---|---|---|
| 4 | 1 | 1 | 2 | 33 | 0 | 1 | 0 |
Plumas County
Plumas County:
Population: 20,007 (2010)
| Race | Percent of Population |
|---|---|
| Caucasian | 84.5% |
| Hispanic/Latino | 8.5% |
| African American | 1.0% |
| Asian | 0.9% |
| Two or More Races Reported | 3.5% |
| American Indian/Native Alaskan | 3.1% |
| Native Hawaiian/Pacific Islander | 0.1% |
| Other | Percent of Population |
| Foreign Born | 6.2% |
| Language other than English in Home | 8.5% |
Congregations and Adherents as Percentage of Population (1980 and 2010)
| Year | Number of Congregations | Percent of Population |
|---|---|---|
| 1980 | 31 | 26.7% |
| 2010 | 41 | 22.5% |
Number of Minority Faith Congregations (2010)
| Baha’i | Buddhist | Hindu | Jewish | LDS | Muslim | Orthodox | Sikh |
|---|---|---|---|---|---|---|---|
| 0 | 0 | 0 | 0 | 3 | 0 | 0 | 0 |
Riverside County
Riverside County:
Population: 2,189,641 (2010)
| Race | Percent of Population |
|---|---|
| Caucasian | 39.1% |
| Hispanic/Latino | 46.1% |
| African American | 7.0% |
| Asian | 6.5% |
| Two or More Races Reported | 3.3% |
| American Indian/Native Alaskan | 1.9% |
| Native Hawaiian/Pacific Islander | 0.4% |
| Other | Percent of Population |
| Foreign Born | 22.2% |
| Language other than English in Home | 39.9% |
Congregations and Adherents as Percentage of Population (1980 and 2010)
| Year | Number of Congregations | Percent of Population |
|---|---|---|
| 1980 | 408 | 29.8% |
| 2010 | 1,140 | 44.4% |
Number of Minority Faith Congregations (2010)
| Baha’i | Buddhist | Hindu | Jewish | LDS | Muslim | Orthodox | Sikh |
|---|---|---|---|---|---|---|---|
| 10 | 13 | 6 | 9 | 96 | 8 | 11 | 3 |
Sacramento County
Sacramento County:
Population: 1,418,788 (2010)
| Race | Percent of Population |
|---|---|
| Caucasian | 48.1% |
| Hispanic/Latino | 22.0% |
| African American | 10.9% |
| Asian | 15.0% |
| Two or More Races Reported | 5.7% |
| American Indian/Native Alaskan | 1.6% |
| Native Hawaiian/Pacific Islander | 1.1% |
| Other | Percent of Population |
| Foreign Born | 19.6% |
| Language other than English in Home | 30.5% |
Congregations and Adherents as Percentage of Population (1980 and 2010)
| Year | Number of Congregations | Percent of Population |
|---|---|---|
| 1980 | 365 | 30.7% |
| 2010 | 876 | 37.1% |
Number of Minority Faith Congregations (2010)
| Baha’i | Buddhist | Hindu | Jewish | LDS | Muslim | Orthodox | Sikh |
|---|---|---|---|---|---|---|---|
| 8 | 28 | 13 | 7 | 78 | 11 | 12 | 1 |
San Benito County
San Benito County:
Population: 55,269 (2010)
| Race | Percent of Population |
|---|---|
| Caucasian | 37.8% |
| Hispanic/Latino | 56.9% |
| African American | 1.2% |
| Asian | 3.2% |
| Two or More Races Reported | 3.3% |
| American Indian/Native Alaskan | 3.1% |
| Native Hawaiian/Pacific Islander | 0.3% |
| Other | Percent of Population |
| Foreign Born | 21.2% |
| Language other than English in Home | 39.5% |
Congregations and Adherents as Percentage of Population (1980 and 2010)
| Year | Number of Congregations | Percent of Population |
|---|---|---|
| 1980 | 16 | 27.1% |
| 2010 | 32 | 64.6% |
Number of Minority Faith Congregations (2010)
| Baha’i | Buddhist | Hindu | Jewish | LDS | Muslim | Orthodox | Sikh |
|---|---|---|---|---|---|---|---|
| 1 | 0 | 0 | 0 | 3 | 0 | 0 | 0 |
San Bernardino County
San Bernardino County:
Population: 2,035,210 (2010)
| Race | Percent of Population |
|---|---|
| Caucasian | 32.7% |
| Hispanic/Latino | 49.9% |
| African American | 9.6% |
| Asian | 6.9% |
| Two or More Races Reported | 3.3% |
| American Indian/Native Alaskan | 2.0% |
| Native Hawaiian/Pacific Islander | 0.5% |
| Other | Percent of Population |
| Foreign Born | 21.4% |
| Language other than English in Home | 40.9% |
Congregations and Adherents as Percentage of Population (1980 and 2010)
| Year | Number of Congregations | Percent of Population |
|---|---|---|
| 1980 | 554 | 33.6% |
| 2010 | 1,274 | 40.0% |
Number of Minority Faith Congregations (2010)
| Baha’i | Buddhist | Hindu | Jewish | LDS | Muslim | Orthodox | Sikh |
|---|---|---|---|---|---|---|---|
| 6 | 13 | 8 | 6 | 104 | 14 | 10 | 1 |
San Diego County
San Diego County:
Population: 3,095,313 (2010)
| Race | Percent of Population |
|---|---|
| Caucasian | 48.0% |
| Hispanic/Latino | 32.5% |
| African American | 5.6% |
| Asian | 11.4% |
| Two or More Races Reported | 4.1% |
| American Indian/Native Alaskan | 1.4% |
| Native Hawaiian/Pacific Islander | 0.6% |
| Other | Percent of Population |
| Foreign Born | 23.2% |
| Language other than English in Home | 36.7% |
Congregations and Adherents as Percentage of Population (1980 and 2010)
| Year | Number of Congregations | Percent of Population |
|---|---|---|
| 1980 | 752 | 29.8% |
| 2010 | 1,720 | 43.9% |
Number of Minority Faith Congregations (2010)
| Baha’i | Buddhist | Hindu | Jewish | LDS | Muslim | Orthodox | Sikh |
|---|---|---|---|---|---|---|---|
| 19 | 59 | 19 | 30 | 120 | 19 | 19 | 2 |
San Francisco County
San Francisco County:
Population: 805,235 (2010)
| Race | Percent of Population |
|---|---|
| Caucasian | 41.8% |
| Hispanic/Latino | 15.4% |
| African American | 6.3% |
| Asian | 33.9% |
| Two or More Races Reported | 4.0% |
| American Indian/Native Alaskan | 0.9% |
| Native Hawaiian/Pacific Islander | 0.5% |
| Other | Percent of Population |
| Foreign Born | 35.6% |
| Language other than English in Home | 45.3% |
Congregations and Adherents as Percentage of Population (1980 and 2010)
| Year | Number of Congregations | Percent of Population |
|---|---|---|
| 1980 | 254 | 30.7% |
| 2010 | 521 | 35.3% |
Number of Minority Faith Congregations (2010)
| Baha’i | Buddhist | Hindu | Jewish | LDS | Muslim | Orthodox | Sikh |
|---|---|---|---|---|---|---|---|
| 1 | 40 | 14 | 14 | 6 | 6 | 17 | 1 |
San Joaquin County
San Joaquin County:
Population: 685,306 (2010)
| Race | Percent of Population |
|---|---|
| Caucasian | 35.4% |
| Hispanic/Latino | 39.4% |
| African American | 8.2% |
| Asian | 15.5% |
| Two or More Races Reported | 4.9% |
| American Indian/Native Alaskan | 2.0% |
| Native Hawaiian/Pacific Islander | 0.7% |
| Other | Percent of Population |
| Foreign Born | 23.1% |
| Language other than English in Home | 39.0% |
Congregations and Adherents as Percentage of Population (1980 and 2010)
| Year | Number of Congregations | Percent of Population |
|---|---|---|
| 1980 | 225 | 39.8% |
| 2010 | 452 | 44.1% |
Number of Minority Faith Congregations (2010)
| Baha’i | Buddhist | Hindu | Jewish | LDS | Muslim | Orthodox | Sikh |
|---|---|---|---|---|---|---|---|
| 1 | 11 | 2 | 2 | 25 | 9 | 2 | 2 |
San Luis Obispo County
San Luis Obispo County:
Population: 269,637 (2010)
| Race | Percent of Population |
|---|---|
| Caucasian | 70.2% |
| Hispanic/Latino | 21.3% |
| African American | 2.4% |
| Asian | 3.7% |
| Two or More Races Reported | 3.2% |
| American Indian/Native Alaskan | 1.4% |
| Native Hawaiian/Pacific Islander | 0.2% |
| Other | Percent of Population |
| Foreign Born | 10.5% |
| Language other than English in Home | 16.8% |
Congregations and Adherents as Percentage of Population (1980 and 2010)
| Year | Number of Congregations | Percent of Population |
|---|---|---|
| 1980 | 117 | 28.5% |
| 2010 | 263 | 54.0% |
Number of Minority Faith Congregations (2010)
| Baha’i | Buddhist | Hindu | Jewish | LDS | Muslim | Orthodox | Sikh |
|---|---|---|---|---|---|---|---|
| 3 | 4 | 2 | 3 | 13 | 2 | 2 | 0 |
San Mateo County
San Mateo County:
Population: 718,451 (2010)
| Race | Percent of Population |
|---|---|
| Caucasian | 41.9% |
| Hispanic/Latino | 25.6% |
| African American | 3.2% |
| Asian | 25.8% |
| Two or More Races Reported | 4.1% |
| American Indian/Native Alaskan | 0.9% |
| Native Hawaiian/Pacific Islander | 1.6% |
| Other | Percent of Population |
| Foreign Born | 34.1% |
| Language other than English in Home | 44.9% |
Congregations and Adherents as Percentage of Population (1980 and 2010)
| Year | Number of Congregations | Percent of Population |
|---|---|---|
| 1980 | 226 | 33.1% |
| 2010 | 357 | 46.1% |
Number of Minority Faith Congregations (2010)
| Baha’i | Buddhist | Hindu | Jewish | LDS | Muslim | Orthodox | Sikh |
|---|---|---|---|---|---|---|---|
| 7 | 17 | 7 | 5 | 22 | 4 | 5 | 0 |
Santa Barbara County
Santa Barbara County:
Population: 423,895 (2010)
| Race | Percent of Population |
|---|---|
| Caucasian | 47.2% |
| Hispanic/Latino | 43.4% |
| African American | 2.4% |
| Asian | 5.5% |
| Two or More Races Reported | 3.5% |
| American Indian/Native Alaskan | 2.2% |
| Native Hawaiian/Pacific Islander | 0.3% |
| Other | Percent of Population |
| Foreign Born | 23.5% |
| Language other than English in Home | 39.3% |
Congregations and Adherents as Percentage of Population (1980 and 2010)
| Year | Number of Congregations | Percent of Population |
|---|---|---|
| 1980 | 147 | 34.9% |
| 2010 | 299 | 47.6% |
Number of Minority Faith Congregations (2010)
| Baha’i | Buddhist | Hindu | Jewish | LDS | Muslim | Orthodox | Sikh |
|---|---|---|---|---|---|---|---|
| 3 | 10 | 6 | 4 | 15 | 2 | 7 | 0 |
Santa Clara County
Santa Clara County:
Population: 1,781,642 (2010)
| Race | Percent of Population |
|---|---|
| Caucasian | 34.8% |
| Hispanic/Latino | 27.2% |
| African American | 3.0% |
| Asian | 32.9% |
| Two or More Races Reported | 3.9% |
| American Indian/Native Alaskan | 1.4% |
| Native Hawaiian/Pacific Islander | 0.5% |
| Other | Percent of Population |
| Foreign Born | 36.9% |
| Language other than English in Home | 50.5% |
Congregations and Adherents as Percentage of Population (1980 and 2010)
| Year | Number of Congregations | Percent of Population |
|---|---|---|
| 1980 | 447 | 28.1% |
| 2010 | 927 | 43.6% |
Number of Minority Faith Congregations (2010)
| Baha’i | Buddhist | Hindu | Jewish | LDS | Muslim | Orthodox | Sikh |
|---|---|---|---|---|---|---|---|
| 14 | 59 | 41 | 16 | 46 | 17 | 17 | 3 |
Santa Cruz County
Santa Cruz County:
Population: 262,382 (2010)
| Race | Percent of Population |
|---|---|
| Caucasian | 59.0% |
| Hispanic/Latino | 32.7% |
| African American | 1.4% |
| Asian | 4.8% |
| Two or More Races Reported | 3.9% |
| American Indian/Native Alaskan | 1.7% |
| Native Hawaiian/Pacific Islander | 0.2% |
| Other | Percent of Population |
| Foreign Born | 18.6% |
| Language other than English in Home | 30.3% |
Congregations and Adherents as Percentage of Population (1980 and 2010)
| Year | Number of Congregations | Percent of Population |
|---|---|---|
| 1980 | 108 | 26.5% |
| 2010 | 184 | 31.0% |
Number of Minority Faith Congregations (2010)
| Baha’i | Buddhist | Hindu | Jewish | LDS | Muslim | Orthodox | Sikh |
|---|---|---|---|---|---|---|---|
| 6 | 16 | 9 | 2 | 6 | 1 | 4 | 0 |
Shasta County
Shasta County:
Population: 177,223 (2010)
| Race | Percent of Population |
|---|---|
| Caucasian | 82.0% |
| Hispanic/Latino | 8.8% |
| African American | 1.0% |
| Asian | 2.7% |
| Two or More Races Reported | 4.0% |
| American Indian/Native Alaskan | 3.0% |
| Native Hawaiian/Pacific Islander | 0.2% |
| Other | Percent of Population |
| Foreign Born | 5.4% |
| Language other than English in Home | 8.8% |
Congregations and Adherents as Percentage of Population (1980 and 2010)
| Year | Number of Congregations | Percent of Population |
|---|---|---|
| 1980 | 84 | 24.3% |
| 2010 | 164 | 27.0% |
Number of Minority Faith Congregations (2010)
| Baha’i | Buddhist | Hindu | Jewish | LDS | Muslim | Orthodox | Sikh |
|---|---|---|---|---|---|---|---|
| 1 | 1 | 0 | 1 | 12 | 1 | 5 | 1 |
Sierra County
Sierra County:
Population: 3,240 (2010)
| Race | Percent of Population |
|---|---|
| Caucasian | 87.0% |
| Hispanic/Latino | 8.9% |
| African American | 0.4% |
| Asian | 0.4% |
| Two or More Races Reported | 2.2% |
| American Indian/Native Alaskan | 1.6% |
| Native Hawaiian/Pacific Islander | 0.1% |
| Other | Percent of Population |
| Foreign Born | 5.7% |
| Language other than English in Home | 6.8% |
Congregations and Adherents as Percentage of Population (1980 and 2010)
| Year | Number of Congregations | Percent of Population |
|---|---|---|
| 1980 | 11 | 25.2% |
| 2010 | 9 | 15.1% |
Number of Minority Faith Congregations (2010)
| Baha’i | Buddhist | Hindu | Jewish | LDS | Muslim | Orthodox | Sikh |
|---|---|---|---|---|---|---|---|
| 0 | 0 | 0 | 0 | 1 | 0 | 0 | 0 |
Siskiyou County
Siskiyou County:
Population: 44,900 (2010)
| Race | Percent of Population |
|---|---|
| Caucasian | 79.1% |
| Hispanic/Latino | 10.7% |
| African American | 1.4% |
| Asian | 1.3% |
| Two or More Races Reported | 4.7% |
| American Indian/Native Alaskan | 4.4% |
| Native Hawaiian/Pacific Islander | 0.3% |
| Other | Percent of Population |
| Foreign Born | 5.7% |
| Language other than English in Home | 10.1% |
Congregations and Adherents as Percentage of Population (1980 and 2010)
| Year | Number of Congregations | Percent of Population |
|---|---|---|
| 1980 | 71 | 33.7% |
| 2010 | 92 | 28.6% |
Number of Minority Faith Congregations (2010)
| Baha’i | Buddhist | Hindu | Jewish | LDS | Muslim | Orthodox | Sikh |
|---|---|---|---|---|---|---|---|
| 0 | 1 | 1 | 0 | 5 | 0 | 0 | 0 |
Solano County
Solano County:
Population: 413,344 (2010)
| Race | Percent of Population |
|---|---|
| Caucasian | 40.6% |
| Hispanic/Latino | 24.6% |
| African American | 15.2% |
| Asian | 15.2% |
| Two or More Races Reported | 6.5% |
| American Indian/Native Alaskan | 1.2% |
| Native Hawaiian/Pacific Islander | 1.0% |
| Other | Percent of Population |
| Foreign Born | 20.0% |
| Language other than English in Home | 29.4% |
Congregations and Adherents as Percentage of Population (1980 and 2010)
| Year | Number of Congregations | Percent of Population |
|---|---|---|
| 1980 | 121 | 29.8% |
| 2010 | 294 | 37.6% |
Number of Minority Faith Congregations (2010)
| Baha’i | Buddhist | Hindu | Jewish | LDS | Muslim | Orthodox | Sikh |
|---|---|---|---|---|---|---|---|
| 4 | 3 | 2 | 1 | 22 | 3 | 2 | 1 |
Sonoma County
Sonoma County:
Population: 483,878 (2010)
| Race | Percent of Population |
|---|---|
| Caucasian | 65.7% |
| Hispanic/Latino | 25.4% |
| African American | 1.9% |
| Asian | 4.1% |
| Two or More Races Reported | 3.6% |
| American Indian/Native Alaskan | 2.2% |
| Native Hawaiian/Pacific Islander | 0.4% |
| Other | Percent of Population |
| Foreign Born | 16.4% |
| Language other than English in Home | 24.2% |
Congregations and Adherents as Percentage of Population (1980 and 2010)
| Year | Number of Congregations | Percent of Population |
|---|---|---|
| 1980 | 172 | 29.0% |
| 2010 | 315 | 35.1% |
Number of Minority Faith Congregations (2010)
| Baha’i | Buddhist | Hindu | Jewish | LDS | Muslim | Orthodox | Sikh |
|---|---|---|---|---|---|---|---|
| 2 | 26 | 2 | 5 | 18 | 2 | 7 | 0 |
Stanislaus County
Stanislaus County:
Population: 514,453 (2010)
| Race | Percent of Population |
|---|---|
| Caucasian | 46.0% |
| Hispanic/Latino | 42.6% |
| African American | 3.3% |
| Asian | 5.7% |
| Two or More Races Reported | 3.8% |
| American Indian/Native Alaskan | 1.9% |
| Native Hawaiian/Pacific Islander | 0.8% |
| Other | Percent of Population |
| Foreign Born | 20.5% |
| Language other than English in Home | 40.5% |
Congregations and Adherents as Percentage of Population (1980 and 2010)
| Year | Number of Congregations | Percent of Population |
|---|---|---|
| 1980 | 198 | 33.6% |
| 2010 | 389 | 39.3% |
Number of Minority Faith Congregations (2010)
| Baha’i | Buddhist | Hindu | Jewish | LDS | Muslim | Orthodox | Sikh |
|---|---|---|---|---|---|---|---|
| 2 | 5 | 1 | 1 | 32 | 1 | 2 | 2 |
Sutter County
Sutter County:
Population: 94,737 (2010)
| Race | Percent of Population |
|---|---|
| Caucasian | 49.7% |
| Hispanic/Latino | 29.4% |
| African American | 2.4% |
| Asian | 15.5% |
| Two or More Races Reported | 4.1% |
| American Indian/Native Alaskan | 2.3% |
| Native Hawaiian/Pacific Islander | 0.4% |
| Other | Percent of Population |
| Foreign Born | 22.5% |
| Language other than English in Home | 35.9% |
Congregations and Adherents as Percentage of Population (1980 and 2010)
| Year | Number of Congregations | Percent of Population |
|---|---|---|
| 1980 | 34 | 29.8% |
| 2010 | 70 | 31.4% |
Number of Minority Faith Congregations (2010)
| Baha’i | Buddhist | Hindu | Jewish | LDS | Muslim | Orthodox | Sikh |
|---|---|---|---|---|---|---|---|
| 0 | 0 | 1 | 1 | 8 | 1 | 0 | 4 |
Tehama County
Tehama County:
Population: 63,463 (2010)
| Race | Percent of Population |
|---|---|
| Caucasian | 85.5% |
| Hispanic/Latino | 21.9% |
| African American | 1.1% |
| Asian | 1.6% |
| Two or More Races Reported | 4.3% |
| American Indian/Native Alaskan | 4.8% |
| Native Hawaiian/Pacific Islander | 0.3% |
| Other | Percent of Population |
| Foreign Born | 10.6% |
| Language other than English in Home | 19.2% |
Congregations and Adherents as Percentage of Population (1980 and 2010)
| Year | Number of Congregations | Percent of Population |
|---|---|---|
| 1980 | 41 | 25.8% |
| 2010 | 60 | 29.6% |
Number of Minority Faith Congregations (2010)
| Baha’i | Buddhist | Hindu | Jewish | LDS | Muslim | Orthodox | Sikh |
|---|---|---|---|---|---|---|---|
| 1 | 0 | 0 | 0 | 3 | 0 | 1 | 0 |
Trinity County
Trinity County:
Population: 13,786 (2010)
| Race | Percent of Population |
|---|---|
| Caucasian | 83.0% |
| Hispanic/Latino | 7.4% |
| African American | 0.5% |
| Asian | 0.8% |
| Two or More Races Reported | 4.8% |
| American Indian/Native Alaskan | 5.2% |
| Native Hawaiian/Pacific Islander | 10.0% |
| Other | Percent of Population |
| Foreign Born | 3.8% |
| Language other than English in Home | 7.0% |
Congregations and Adherents as Percentage of Population (1980 and 2010)
| Year | Number of Congregations | Percent of Population |
|---|---|---|
| 1980 | 16 | 12.4% |
| 2010 | 26 | 13.1% |
Number of Minority Faith Congregations (2010)
| Baha’i | Buddhist | Hindu | Jewish | LDS | Muslim | Orthodox | Sikh |
|---|---|---|---|---|---|---|---|
| 0 | 1 | 0 | 0 | 2 | 0 | 0 | 0 |
Tulare County
Tulare County:
Population: 442,179 (2010)
| Race | Percent of Population |
|---|---|
| Caucasian | 32.0% |
| Hispanic/Latino | 61.3% |
| African American | 2.2% |
| Asian | 3.9% |
| Two or More Races Reported | 2.4% |
| American Indian/Native Alaskan | 2.8% |
| Native Hawaiian/Pacific Islander | 0.2% |
| Other | Percent of Population |
| Foreign Born | 23.1% |
| Language other than English in Home | 47.5% |
Congregations and Adherents as Percentage of Population (1980 and 2010)
| Year | Number of Congregations | Percent of Population |
|---|---|---|
| 1980 | 242 | 40.4% |
| 2010 | 407 | 40.7% |
Number of Minority Faith Congregations (2010)
| Baha’i | Buddhist | Hindu | Jewish | LDS | Muslim | Orthodox | Sikh |
|---|---|---|---|---|---|---|---|
| 1 | 5 | 0 | 1 | 16 | 2 | 2 | 0 |
Tuolumne County
Tuolumne County:
Population: 55,365 (2010)
| Race | Percent of Population |
|---|---|
| Caucasian | 81.3% |
| Hispanic/Latino | 11.3% |
| African American | 2.3% |
| Asian | 1.2% |
| Two or More Races Reported | 3.2% |
| American Indian/Native Alaskan | 2.2% |
| Native Hawaiian/Pacific Islander | 0.2% |
| Other | Percent of Population |
| Foreign Born | 4.4% |
| Language other than English in Home | 7.7% |
Congregations and Adherents as Percentage of Population (1980 and 2010)
| Year | Number of Congregations | Percent of Population |
|---|---|---|
| 1980 | 30 | 19.1% |
| 2010 | 66 | 45.0% |
Number of Minority Faith Congregations (2010)
| Baha’i | Buddhist | Hindu | Jewish | LDS | Muslim | Orthodox | Sikh |
|---|---|---|---|---|---|---|---|
| 1 | 1 | 0 | 0 | 3 | 0 | 1 | 0 |
Ventura County
Ventura County:
Population: 823,318 (2010)
| Race | Percent of Population |
|---|---|
| Caucasian | 48.1% |
| Hispanic/Latino | 40.9% |
| African American | 2.2% |
| Asian | 7.2% |
| Two or More Races Reported | 3.2% |
| American Indian/Native Alaskan | 1.8% |
| Native Hawaiian/Pacific Islander | 0.3% |
| Other | Percent of Population |
| Foreign Born | 22.8% |
| Language other than English in Home | 37.4% |
Congregations and Adherents as Percentage of Population (1980 and 2010)
| Year | Number of Congregations | Percent of Population |
|---|---|---|
| 1980 | 238 | 35.0% |
| 2010 | 482 | 44.8% |
Number of Minority Faith Congregations (2010)
| Baha’i | Buddhist | Hindu | Jewish | LDS | Muslim | Orthodox | Sikh |
|---|---|---|---|---|---|---|---|
| 8 | 11 | 11 | 14 | 46 | 3 | 7 | 0 |
Yolo County
Yolo County:
Population: 200,849 (2010)
| Race | Percent of Population |
|---|---|
| Caucasian | 48.9% |
| Hispanic/Latino | 30.5% |
| African American | 3.0% |
| Asian | 14.1% |
| Two or More Races Reported | 4.8% |
| American Indian/Native Alaskan | 1.9% |
| Native Hawaiian/Pacific Islander | 0.6% |
| Other | Percent of Population |
| Foreign Born | 21.2% |
| Language other than English in Home | 34.5% |
Congregations and Adherents as Percentage of Population (1980 and 2010)
| Year | Number of Congregations | Percent of Population |
|---|---|---|
| 1980 | 69 | 30.1% |
| 2010 | 138 | 36.3% |
Number of Minority Faith Congregations (2010)
| Baha’i | Buddhist | Hindu | Jewish | LDS | Muslim | Orthodox | Sikh |
|---|---|---|---|---|---|---|---|
| 3 | 5 | 1 | 1 | 9 | 4 | 2 | 1 |
Yuba County
Yuba County:
Population: 72,155 (2010)
| Race | Percent of Population |
|---|---|
| Caucasian | 57.9% |
| Hispanic/Latino | 25.9% |
| African American | 3.9% |
| Asian | 7.2% |
| Two or More Races Reported | 5.9% |
| American Indian/Native Alaskan | 3.1% |
| Native Hawaiian/Pacific Islander | 0.5% |
| Other | Percent of Population |
| Foreign Born | 11.7% |
| Language other than English in Home | 24.9% |
Congregations and Adherents as Percentage of Population (1980 and 2010)
| Year | Number of Congregations | Percent of Population |
|---|---|---|
| 1980 | 37 | 24.2% |
| 2010 | 66 | 32.7% |
Number of Minority Faith Congregations (2010)
| Baha’i | Buddhist | Hindu | Jewish | LDS | Muslim | Orthodox | Sikh |
|---|---|---|---|---|---|---|---|
| 0 | 1 | 0 | 0 | 5 | 0 | 0 | 1 |